Overview
Neboard is a live BTCUSDT perpetual futures monitor. It streams real-time price and order-flow data and surfaces a live read of structure, flow, levels and derivatives context alongside the chart. Nothing on this dashboard places or manages trades. It is a read-only window built for learning to read the market.
The page is structured in four main zones:
Timeframe selector, signal search, connection status, menu
Live price, 24h range & volume, session label, liquidity ratio
Candlestick chart with overlays: setups, POC, session VPs, footprint
Tabbed: Volume · Tech · Liq · Readout. Split view supported via the ⇿ button
A floating Readout panel (drag its header to reposition, toggle with Rdt) shows the live values of every signal input: structure, order flow, levels, and derivatives data.
Masthead & navigation
Timeframe buttons: 5m / 15m / 1h / 4h
Switches the chart between 5-minute, 15-minute, 1-hour and 4-hour candlesticks. All data comes from the same pool of 5m bars; the browser aggregates them into the target timeframe on the fly, so switching is instant. The liquidity ratio in the ticker strip adapts: on 5m it looks at the last 1 hour; on 4h it spans the last 48 hours.
Trend signals are evaluated on 15m bars with 4h structure context. The 15m view is the most relevant for following live signal state.
Telegram link
The paper-plane icon next to BTCUSDT.P in the masthead opens the project's public Telegram group in a new tab — that's the channel for feedback, ideas, and announcements.
Connection indicator
Live data feed connected; updates every ~15s plus live price ticks. Offline Disconnected. The browser retries automatically.
Menu (≡)
The hamburger menu at the right of the masthead links to the Intro page (the project story) and this Help reference. Both open in new tabs.
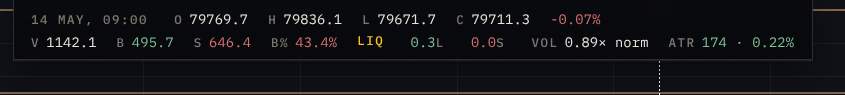
Ticker strip
The strip on the left shows four live metrics alongside the current price and 24h change.
| Field | Meaning |
|---|---|
| Price & Δ% | Last traded price, updated continuously from the live tape. Arrow (▲/▼) shows change from the previous bar on the active timeframe. |
| Range | 24h High − Low in USD. Computed from the last 24h of bars. Wider range = higher intraday volatility. |
| 24h Vol | Total BTC traded over the last 24h of bars. K = thousands. Useful for spotting unusually high or low activity. |
| Session | Current session label keyed off UTC hour (weekdays only): Pre-London 05:00–07:00 · London 07:00–11:00 · Pre-NY 11:00–13:00 · NY 13:00–19:00 · NY Late 19:00–21:00 · Off-hours outside those · Weekend Sat/Sun. (Different from the Syd/Asn/Lon/NY chart overlay boxes — those are volume-profile windows, this label is the active liquidity regime.) |
| Liquidity | Current BTC/5m volume vs the 3-year historical median for this day-of-week and hour. ≥ 0.8× normal · 0.5–0.8× below average · < 0.5× thin: vol-quality gate may suppress signals. TF label (e.g. 0.62× 15m) shows the active window. |
Chart toggles
The row of buttons along the right edge of the chart controls which overlays are visible. Active = highlighted. Click to toggle.
Signals & grading
Signal markers are the Neuro layer of Neboard: a set of AI-biased strategies that watch the same inputs as the Readout (structure, flow, levels, derivatives) and drop a long or short marker on the bar where their gates lined up. Toggle them on the chart with Sig (trend) and Rev (reversal).
Signals only fire during active trading hours: Monday to Saturday, 07:00 to 23:00 CEST. The window is empirical, not arbitrary. Splitting the historical data by hour and weekday showed the excluded slots (Sundays, late nights, the small hours before Europe wakes up) were consistently net-negative: thin liquidity, wider spreads, and the same setup that works during London or New York hours tends to fail when bots chasing late-night ticks are the only participants. The active window keeps the wins and drops most of the bleed.
This is still an early beta. The chart only marks direction (long or short) and grade. It does not show entry, stop, or target levels, and it does not manage a trade for you. Treat every marker as one more piece of confluence on top of your own read, not as an instruction.
The engine also does not catch every good trade. Plenty of clean moves go by without a marker because at least one gate did not fire. That is the work-in-progress part: every iteration is about catching more of the real moves without letting in more of the bad ones.
Trend vs Reversal
Two different layers, two different jobs. Sig (trend) is the workhorse: it catches continuation moves while structure and flow are aligned. Rev (reversal) is rarer and counter-trend by design: it catches the moment a stretched move runs out of fuel, typically a 4H outside-engulfing candle in an exhausted state. Different bar pattern, different exit math (tight ATR trail rather than fixed TP1 / TP2), different cadence.
| Marker | Meaning |
|---|---|
| Sig ▲ / ▼ | Trend setup: structure, flow alignment and risk gates all fired in the same direction. Evaluated on 15m bars with 4H structure context. |
| Rev ↺ | Reversal setup: outside-engulfing 4H candle in a stretched / exhausted state. Counter-trend, lower frequency, ATR-trail exit. |
How to weight a Rev marker. Reversal is less mature than the trend stack: it has not been walk-forward-validated, and the engulfing edge depends heavily on regime (strong in parabolic markets, weaker in chop). The strongest context for a Rev is when an exhaustion read on the Readout backs it up: price stretched far above the POC in ATR units, CVD divergent against the move, momentum fading. A Rev that prints against an otherwise clean trending Readout is the weakest version and the easiest to skip.
Grading: A / B / C
Each setup carries a confidence grade derived from a weighted score across the gates that fired (structure alignment across 4H/1H/15M, flow, levels vs POC/ATR, vol-quality, and derivatives context).
| Grade | What it means |
|---|---|
| A | Every primary gate fired cleanly and the score sits in the top band. The cleanest setups the model surfaces. |
| B | Solid setup with one or two soft spots: a partially aligned timeframe, marginal flow, or middling vol-quality. |
| C | Marginal pass: enough gates fired to qualify, but several inputs are weak. Lowest confidence band. |
The grade is a confidence label, not a guarantee. A's still lose and C's still win; the grade tracks expectancy across a large sample, not the outcome of any single trade.
Backtested against the last two years of BTC perpetual data, roughly 25% of triggered setups close in profit, with a profit factor of around 1.6 to 1.75. The edge is in winner size, not win frequency: winners simply run further than losers do. Numbers move as the gates and scoring evolve.
Use markers as a layer of confluence on top of your own strategy, not as a strategy on their own. A signal lining up with a read you already have is one more reason to act; a signal in isolation isn't a trade.
The chart
Candles
Standard OHLC candlesticks. Green = close above open. Red = close below open. Wicks show the full high/low range. The current (forming) bar is reconstructed from 1m closes in real time, its volume ticks up every minute.
Volume bars
Each volume bar is split into taker-buy BTC (green, above zero) and taker-sell BTC (red, below zero). A tall green portion = buyers lifting the ask aggressively. A tall red portion = sellers hitting the bid.
Session VP overlays
Bitcoin trades 24/7 but the participants don't, liquidity rotates between Sydney, Tokyo, London and New York, and each handover changes the character of price action. Day traders care because session opens routinely produce range expansions and sweeps of the prior session's extremes, and yesterday's value area often acts as today's reference.
Toggle Syd · Asn · Lon · NY and each session is drawn as a colored box on the chart:
- Left/right borders = session start and end times.
- Top/bottom borders = session high and low.
- POC: solid line inside the box. The single price level with the most traded volume during that session.
- VAH / VAL: dashed lines. The Value Area High/Low; together they bound roughly 70% of the session's volume.
For completed sessions the POC, VAH and VAL also extend as thin reference lines across the rest of the chart, so the prior session's key levels stay visible against current price in real time. Each session uses its own color: Sydney amber · Tokyo purple · London blue · New York orange.
Trade Profile footprint (1H only)
When Prf is on and TF is 1H, each candle column shows a mini footprint. Each $50 bucket has two numbers: left = taker-buy BTC, right = taker-sell BTC. Green = buy-heavy · Red = sell-heavy. Bucket size and column width auto-aggregate to stay readable at any zoom.
Hover info
Move the crosshair over any candle and a small overlay near the top of the chart shows the full breakdown of that bar. It updates live as you hover and disappears when the cursor leaves the chart.
Two rows, left to right:
- Row 1 — price: bar timestamp · O open · H high · L low · C close · close-vs-open change % (green up / red down).
- Row 2 — flow & context:
- V total volume (BTC) · B taker-buy BTC (green) · S taker-sell BTC (red) · B% taker-buy share (green ≥ 55%, red ≤ 45%, neutral in between).
- LIQ (only if the bar had liquidations): long liquidations in green, short liquidations in red, BTC notional.
- VOL bar volume vs the 23-bar trailing average, labelled spike (≥ 2.0×) · high (≥ 1.3×) · norm · low (≥ 0.5×) · dead (< 0.5×).
- ATR 14-bar Average True Range, in dollars and as % of price — red if extremely tight (< 0.08%), amber if extended (> 0.30%), green in the normal range.
The same panel exists on mobile: long-press and drag on the chart to surface the crosshair and the overlay populates in the same format.
Readout panel
The floating Readout shows the live computed values behind every signal input (structure, flow, levels and derivatives), updating every ~15 seconds. Drag the header to move it; resize the text with the − / + buttons; close with × or toggle with Rdt.
Structure
Determined by comparing swing highs/lows: BULLISH = higher highs + higher lows · BEARISH = lower highs + lower lows · RANGING = no clear sequence.
Ask five traders to draw a trend line on the same chart and you'll get five different trend lines. The structure here doesn't work that way: it's math, not a visual read. The engine walks the bar history, picks out swing highs and lows by comparing actual numeric prices, and counts HH/HL/LH/LL programmatically. Same chart, same answer, every time. The margin of error is mechanical, not subjective.
| Row | Meaning |
|---|---|
| 4H | Primary trend filter: the highest-weight gate. Entries only open when 4H structure aligns with the signal direction. |
| 1H | Secondary confirmation. A 1H CHoCH (change of character) against an open trade is an early warning sign. |
| 15M | Fine-grained momentum. When 15M flips against an open trade, 83% of those trades lose (2026 data): a strong invalidation cue. |
Flow
Derived from the live trade tape, measures who is the aggressor: buyers lifting the ask (bullish) or sellers hitting the bid (bearish).
| Row | Meaning |
|---|---|
| CVD | Cumulative Volume Delta: running total of (taker-buy − taker-sell) BTC. Direction and slope matter more than the absolute level. |
| State | Absorption state: ACCUMULATION (price dips, buyers step in) · DISTRIBUTION (price rises, sellers unload) · NEUTRAL (aligned). |
| Abs 15m | 15-minute absorption: large buy/sell imbalances in recent 1m footprint bars. |
| Abs 1h | 1-hour absorption: same metric smoothed to reduce noise. |
| Abs 4h | 4-hour absorption: long-horizon flow bias; detects regime shifts. |
| Foot | Footprint imbalance in the $50 price buckets nearest current price, scored from the last 15m of profiles. |
Reading an absorption row
When the composite triggers, the row shows a direction arrow, an intensity score, a fill bar, and the three underlying components, for example: ↓ 31 · buy 62% · vol 1.47× · px −0.15.
- ↑ / ↓: direction. ↑ bullish absorption (sellers absorbed) · ↓ bearish absorption (buyers absorbed).
- Intensity 0–100 + matching fill bar: strength of the signal. ≤30 mild · 30–60 moderate · >60 strong.
- buy %: taker-buy share of volume. >55% buyers were the aggressors; <45% sellers were.
- vol ×: window volume vs baseline (effort). ≥1.3–1.5× = real participation, not a quiet drift.
- px ATR: price progress in ATR units (result). Sign tells you which way price actually went.
The pattern only fires when effort and result disagree. The example above means: 62% of takers were buying, with 1.47× normal volume, but price closed −0.15 ATR down. Aggressive buyers were spending ammo into a passive seller sitting on the offer; the seller's inventory wins. Bearish absorption tends to precede a roll-over once the buy-side runs out of effort. The mirror image (heavy selling that fails to push price down) is bullish absorption (often precedes a bounce).
Rows where the composite didn't trigger show only buy% · vol× · px in dim text; those windows had no clear effort/result mismatch.
Levels
| Row | Meaning |
|---|---|
| POC | Point of Control: price with highest volume in the last 2h. Shown as price + distance in ATR units. Acts as a short-term magnet. |
| ATR | 4H Average True Range in $ and %. Normalises TP/SL placement. The vol-quality gate compares it against a 3-year profile. |
Derivs
| Row | Meaning |
|---|---|
| OI | Open Interest (USD) + 1h % change. Rising OI + rising price = new longs (bullish). Rising OI + falling price = new shorts (bearish). Falling OI = liquidations: move may lack follow-through. |
| Fund | Funding Rate (8h payment between longs and shorts). Positive = longs pay (crowd is long). Extreme readings (±0.1%) often precede reversals as the crowded side gets squeezed. |
Book Clusters (Bk toggle)
The Bk toggle overlays markers on the price chart at moments when the futures order book underwent a sustained one-sided burst. A marker is plotted whenever there were two or more consecutive 15-second snapshots in the same direction with a strong imbalance shift on each.
Each marker is labelled BkN ±$X:
| Element | Meaning |
|---|---|
Bk2 / Bk3 / Bk4 | Cluster size — number of consecutive 15-second snapshots in the burst (so Bk3 ≈ 45 seconds of one-sided pressure). |
| ▼ red (above bar) | Ask cluster — bids being eaten by sellers. Aggressive selling event. |
| ▲ green (below bar) | Bid cluster — bids stacking up or asks being pulled. Passive demand event. |
| Bright vs faded | Brightness scales with cluster size. Size 3+ events render at full saturation; size-2 markers are dimmer. |
±$X dollar number | Realised price move over the 5 minutes after the cluster started. Not a prediction — what actually happened. Lets you eyeball whether each event lined up with a real move. |
Markers are filtered to events where |5-minute price move| ≥ $75; smaller moves are hidden as noise. Up to 50 of the most extreme events from the last 7 days are shown, scored by cluster size × imbalance magnitude × depth shift.
How to read direction vs sign:
- ▼ red with
−$: ask-cluster theory worked — sellers ate bids and price kept dropping. - ▲ green with
+$: bid-cluster acted as real support — bid stacking preceded a rally. - ▲ green with
−$: "fading the falling knife" — buyers stacked bids inside an active downtrend and got run over. This is more common than the green-with-positive-number case.
This is observation, not a signal. A lead-lag study on the same data showed price moves first, the order book follows at sub-minute scale — most of the move you see after a cluster has already happened by the time the cluster prints. The markers exist to make those events visible against the price action, not to act on them in isolation.
Volume panel
The bottom panel has four tabs: Volume, Tech, Liq, and Readout (mirrors the floating Readout overlay so you can park it inline instead of as a floating box). The ⇿ Split button enables side-by-side mode — turn it on, then click a second tab to pin it next to the active one. Click Split again to unpin. Drag the thin handle at the top to resize the whole panel; use Btm in the chart toggles to hide it entirely.
The Volume tab shows per-bar taker flow as a split bar chart. The header stats summarise the current bar:
| Stat | Meaning |
|---|---|
| Buy | Taker-buy BTC: aggressive buyers lifting the ask. Large green bar + green candle = conviction. |
| Sell | Taker-sell BTC: aggressive sellers hitting the bid. |
| B% | Buy percentage. Above 50% = buyers dominating this bar. Extremes (>70% or <30%) = one-sided tape. |
| Δ (Delta) | Taker-buy minus taker-sell. Divergence between price direction and delta (e.g. price rising but delta negative) warns the move lacks real aggression. |
Liq panel
The Liq tab shows forced-liquidation BTC per bar on a dedicated y-axis. Each candle gets two values: how much was force-closed on each side of the book.
| Element | Meaning |
|---|---|
Green bar (up) / L | Long liquidations — long positions force-closed by the exchange when price moved against them. Mechanically these print as sells on the tape, but the panel groups them by which side got liquidated, not by tape direction. |
Red bar (down) / S | Short liquidations — short positions force-closed. Mechanically these print as buys on the tape. |
| Bar magnitude | BTC notional liquidated on that bar's side. Aggregated from 1-minute exchange data into the chart's current timeframe. |
Header stats (L / S) | The two values for the bar currently under the crosshair, updated on hover. — when no bar is hovered or when the bar has no liquidations. |
How to read it
- Big red spike during a move up: shorts capitulating into the rally — the move is being fuelled by forced covering rather than fresh demand. Often marks an exhaustion point near the top.
- Big green spike during a move down: longs flushing out at the lows — same pattern, mirrored. Cascade-style flushes often complete on the largest green bar.
- Sustained one-sided liquidations (multiple bars in a row): the trend is grinding through a positioned cohort. Watch for the moment liquidations fade — that's often where the move runs out of forced flow.
- Most bars empty: normal. Liquidations cluster in volatility spikes; the panel is informative when something fires, not as a continuous read.
This panel is observational. Liquidation data is published with a small delay after each fill, so the rightmost bar fills in over the next ~15s. Useful for context and post-mortem; not a forward-looking signal on its own.
Tech panel
The Tech tab shows individual indicator verdicts (BULL / BEAR / NEUTRAL) with a detail value per row. The header shows the score tally: Buys / Sells / Neutral.
| Indicator | Meaning |
|---|---|
| Bias | Weighted summary of all tech indicators. Not a trade signal: a situational snapshot. |
| 1H Trend | EMA alignment on the 1H chart. BULL = fast above slow. BEAR = fast below slow. |
| S/R Breakout | Whether price has recently closed outside an S/R zone boundary: above resistance or below support. |
| CVD Alignment | CVD pointing in the same direction as price? DIVERGING = move may lack conviction. |
| Mean Rev vs POC | Distance from price to POC. EXTENDED = snap-back more likely. NEAR = at equilibrium. |
| Trend POC/ATR | How far the POC has drifted in trend direction, normalised by ATR. A steadily migrating POC confirms institutional follow-through. |
News panel
The News tab streams BTC-relevant headlines from major crypto outlets (CoinDesk, Cointelegraph, Decrypt, The Block, Bitcoin Magazine) plus regulatory feeds (SEC press releases). Each headline is classified by AI for directional bias and impact — between the headlines and the live order flow, you will feel as if you were connected to the Matrix.
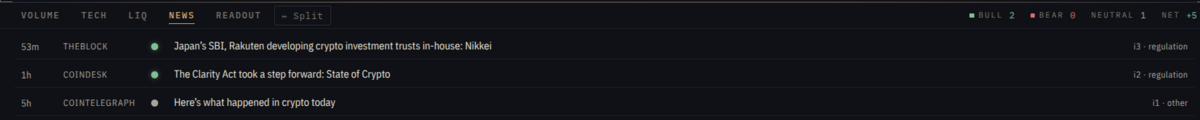
How to read a row
Left → right: time since publication, source, bias dot (● bullish / ● bearish / ● neutral), headline (click to open the article), impact + category.
Impact score (i1–i5)
| Score | What it means |
|---|---|
| i5 | Major catalyst — spot-ETF approval/denial, multi-billion treasury allocation, exchange collapse, FOMC surprise. Row is bolded with a ⚡ prefix and amber accent. |
| i4 | Strong move — large institutional buy/sell, major regulation, big hack. Title text tinted green or red by bias. |
| i3 | Moderate — earnings beats, secondary regulation, large whale moves. |
| i2 | Minor — analyst takes, smaller adoption news. |
| i1 | Background — generic filings, minor altcoin updates, already-priced events. |
Header stats
Bull / Bear / Neutral = counts in the rolling 24-hour window. Net = Σ(impact × direction) across all visible items: positive = net-bullish news flow, negative = net-bearish, magnitude reflects intensity.
Notes
- Window: last 24 hours, capped at 10 items.
- Items republished by feeds (some outlets re-emit weeks of history) are dropped at ingestion.
- Classification is independent of the strategy engine; signals never read this stream directly. It is informational.
ETF Flows panel
The ETF Flows tab tracks the combined daily net flow into and out of the US spot Bitcoin ETFs (IBIT, FBTC, GBTC and the rest), sourced from Farside and refreshed through the day. Since the funds now drive a large share of spot demand, the direction of these flows is a read on where the slowest, largest pool of capital is leaning.
How to read it
Each bar is one US trading day's net flow in US$ millions: green for a net inflow day, red for a net outflow. The most recent day sits on the right.
Header stats
Latest = the most recent day's net flow. 10d Net = the sum across the last ten sessions shown. In / Out = how many of those ten days were inflows versus outflows.
Notes
- Window: last 10 trading days.
- Figures are daily and published a day late (T+1), so treat them as regime context, not an intraday trigger.
- Late revisions from the source are picked up automatically on the next refresh.
- Informational only — the strategy engine never reads this stream.
FAQ
Not necessarily. During low-activity periods (weekends, off-hours) BTC volume can be uniformly below the historical median across all time windows, producing similar ratios. The TF label next to the ratio (e.g. 0.38× 15m) confirms the window is updating when you switch TF. If the label doesn't change, try a hard refresh Ctrl+Shift+R.
Trade profile coverage starts from when the live tape capture began, older bars may not have profile data. Also confirm you are on the 1H timeframe, Prf only renders at 1H. Make sure the browser window is wide enough, the columns clip if there isn't room to draw them.
The vol-quality gate scores the current market environment on four dimensions: ATR vs 3-year profile, volume vs 3-year profile, spread, and session. When the composite score is below the minimum threshold, new entries are suppressed. The Liquidity ratio in the ticker strip is a real-time proxy, a red reading (<0.5×) typically correlates with a low score.
Enable the UTC toggle. By default, chart bar boundaries may be offset by the browser's local timezone. UTC-aligned mode forces 4H boundaries to 00:00, 04:00, 08:00… UTC, the same alignment used internally for structure and reversal detection.
All market data displayed (candles, open interest, funding, trade profiles, liquidations) is sourced from perpetual futures market data feeds. The same data drives structure analysis, order flow and the historical context behind the readings.
Price: live tape, sub-second. Candles, signals, OI/funding, liquidations: every ~15 seconds. Trade profile: incremental update every 15 seconds (only newly closed 1m bars plus the live open bar, full history is sent once at page load).
Your browser is serving a cached version of the page. Do a hard refresh: Ctrl+Shift+R (Windows/Linux) or Cmd+Shift+R (Mac). In DevTools, use "Empty Cache and Hard Reload" from the Network tab (with DevTools open, right-click the refresh button).