Multi-timeframe price action & volume, built for learning, not gambling.
Open dashboard →I'm not a financial advisor; I'm an engineer who likes solving problems. This dashboard exists for educational and learning purposes only. Nothing here is financial advice, a trade recommendation, or a promise of profit.
Futures trading is genuinely risky. People lose real money, sometimes more than they put in. Leverage cuts both ways, markets don't care about your rent, and no tool (including this one) can change that. If you decide to trade, do it with money you can afford to lose, and consider talking to a licensed professional before putting capital on the line.
This dashboard is not a source of truth for trading decisions. No promises of overnight riches here. Just a cleaner, calmer way to learn how to read the market, built by someone who got tired of the noise.
A live research dashboard for the Bitcoin perpetual futures market.
It pulls real-time data straight from the exchange and surfaces the inputs that actually move price: price action and volume, market structure across multiple timeframes, taker flow, key levels, and derivatives context (open interest, funding, forced liquidations). Everything is computed and laid out in one place, so you don't have to flip between charts to glue the picture together.
On top of the raw read sits a signal engine that marks the chart when a defined set of conditions line up. The markers are a research surface, not a signal service: no entries, no targets, no promises. Use them as one more piece of confluence on top of your own read.
Simple: most altcoins move in BTC's shadow. When Bitcoin sneezes, the rest of the market usually catches a cold, so anyone trading an altcoin is effectively trading two things at once: the altcoin itself, and whatever BTC happens to be doing in the background.
By focusing on Bitcoin, you cut out that extra dependency. One less variable to track, one less thing to second-guess, and a much clearer signal to read.
Are there exceptions? Sure. Alt seasons happen, and some coins occasionally march to their own beat. But as a rule of thumb, BTC sets the tone for the room, and starting there keeps things focused.
A pet peeve of mine: I keep seeing traders and signal providers shorting Bitcoin while longing SOL (or some other altcoin) at the same time. I find that extremely strange. Altcoins follow Bitcoin eventually. If BTC is going down hard enough that shorting it makes sense, the alts are not going to stay green for long: they will follow, usually with a bigger drawdown. Picking opposite directions on the two is fighting the same tape from both sides, and the math rarely works out.
Most charting tools are slot machines of indicators, each one telling you a slightly different version of what already happened, painted in pretty colors, stacked on top of each other, lagging behind price by the time you've made sense of them.
This dashboard does things differently. Instead of making you flip between timeframes and mentally glue the picture together, the cross-timeframe context is already done for you: higher timeframe structure, mid-term momentum, and short-term flow, all visible at once without a single click.
Not smoothed, not lagged, not averaged into oblivion. What's happening right now, on the tape.
The 24h range, total volume, current session (Sydney, Asia, London, New York), and how liquid the market is right now compared to the historical median for that same day and hour. Because a move in thin air hits differently than a move with real participation behind it.
Tracking whether buyers or sellers are the aggressor, bar by bar, so you're not guessing intent from a candle colour.
Open interest, funding rate, and forced liquidations (long flushes and short squeezes plotted per bar). The stuff the spot chart crowd can't see.
No more opening five tabs, switching back and forth, and forgetting what you were looking at.
A live panel that surfaces every signal input at once: market structure across timeframes, flow bias, key price levels, and derivatives data. Everything your eye would normally have to hunt for across multiple charts, in one place, updating every few seconds.
These markers are not trade signals. They are a confluence layer — one more input on top of your own read, never a standalone reason to enter a trade.
Underneath the raw read sits a set of AI-biased strategies that watch the same inputs you do (structure, flow, levels, derivatives) and mark the chart when the conditions they were trained for line up. Two flavours: Sig (▲ / ▼) for trend continuation — the workhorse — and Rev (↺) for stretched-move reversals, much rarer and regime-dependent.
Each marker is graded A / B / C by score. The grade is a confidence label, not a guarantee. Markers only print during active hours (Mon–Sat, 07:00–23:00 CEST) — the rest of the week was empirically net-negative.
A marker lining up with a read you already have is one more reason to act. A marker in isolation isn't a trade.
The Readout panel is the closest thing on this dashboard to a co-pilot. It sits in the corner of the chart and updates every few seconds with a live snapshot of what the market is actually doing across three timeframes simultaneously.
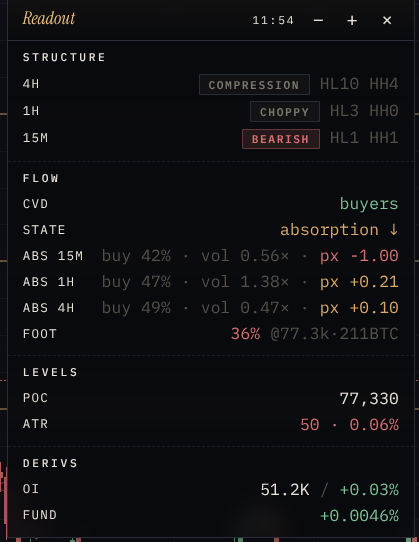
This is the market's skeleton. The Readout reads structure across three timeframes (4H, 1H, and 15M) by looking at whether price is making higher highs and higher lows (bullish), lower highs and lower lows (bearish), or bouncing in circles (ranging).
One thing worth pointing out: ask five traders to draw a trend line on the same chart and you'll get five different trend lines, each one anchored to whatever swing point looked right to them in the moment. The structure here doesn't work that way. It's math, not a visual read. The engine walks the bar history, picks out swing highs and lows by comparing actual numeric prices, and counts HH/HL/LH/LL programmatically. Same chart, same answer, every time. The margin of error is mechanical, not subjective.
The key is alignment. When all three say the same thing, the market has a clear story.
Structure tells you the direction. Flow tells you whether people are actually putting money behind it. It tracks who is being aggressive right now: are buyers lifting the ask (paying up to get in) or are sellers hitting the bid (willing to accept less to get out)?
The CVD is a running total of buy pressure minus sell pressure. The absorption state zooms in further. The footprint looks at what's happening at the exact price levels being traded right now.
Two numbers that tell you where price is relative to meaningful reference points.
The POC is the price where the most volume traded in the last two hours, the market's centre of gravity. Price tends to revisit it. If it's rising steadily, the market is accepting higher prices. If price is stretched far above it, a snap-back is a normal expectation.
The ATR is how much BTC typically moves in a 4H candle, in dollars. It's the market's ruler; everything is measured in ATR units. A 200 dollar move in a high-ATR environment is noise. The same move when ATR is low is significant.
Open Interest and Funding Rate are shown here for awareness, not as signals to act on. Our own testing found them unreliable enough as standalone indicators that we stopped using them as decision factors entirely. That said, they give useful background colour.
Think of Derivs as the weather forecast: interesting context, but you wouldn't cancel your plans based on it alone.
Bitcoin trades around the clock, but the people behind the orders don't. Liquidity rotates across the globe in shifts: Sydney warms things up, Tokyo carries the Asian session, London sets the European tone, and New York brings the heaviest volume and the sharpest moves. Each handover changes the character of price action; the same chart can feel slow and rangey under Asian hours and then explode the moment London opens.
For day trading, this matters more than people give it credit for. Session opens and closes routinely produce range expansions, sweeps of the prior session's high or low, and retests of the levels the last region left behind. The "fair-value" zone where most of a session's volume traded (its VAH / POC / VAL) tends to act as reference for the next session: if New York opens above London's value area, that's a different setup than opening inside it.
Toggle Syd · Asn · Lon · NY on the chart and each session is drawn as a colored box. The left and right borders are the session's start and end times; the top and bottom are the session's high and low. Inside the box you get the volume profile of that window:
For completed sessions the POC, VAH and VAL also extend as thin reference lines across the current chart, so you can see in real time whether price is sitting above, below, or inside the previous session's value area without having to remember the numbers.
The footprint overlay breaks each candle down by price level and shows how much was bought versus sold at every tick inside that bar. Instead of a single coloured candle, you get a vertical strip of numbers: green for aggressive buying, red for aggressive selling, side by side at every price the bar touched. It's the closest thing to seeing the inside of a candle.
Heads up on a small display quirk: the footprint columns need real horizontal room to render properly. If your window is too narrow the rightmost columns get clipped or stack on top of each other. Widen the browser window until you can see the full row of profiles cleanly. That's the intended view.
Honest disclosure: I don't personally use the footprint when I trade. I leaned on structure, flow and levels long before I added it, and that's still where my eyes go first. It's here because some traders find it indispensable, and once you've calibrated to it, it can confirm or contradict what the higher-level read is telling you.
How we get the data: every individual trade that prints on the BTC perpetual is captured live and bucketed by price as it happens, so the column you see is built from the raw tape, not a smoothed or sampled version of it. The bars accumulate as the candle forms and stop updating once it closes.
Bitcoin doesn't trade in a vacuum. A spot-ETF approval, an exchange running into trouble, a Fed statement, a Senate bill clearing committee — these are the moments where price stops respecting whatever clean structure you'd been reading off the chart, and starts respecting the new information instead.
The News panel sits next to Volume, Tech and Liq in the bottom strip. It streams BTC-relevant headlines from major crypto outlets and regulatory feeds as they publish, then a purpose-built AI reads each headline and tags it for directional bias (bullish, bearish, neutral) and impact on a 1-to-5 scale within seconds of it landing. With the chart in front of you, the order flow underneath, and AI-classified news flowing in real time alongside both, you will feel as if you were connected to the Matrix.
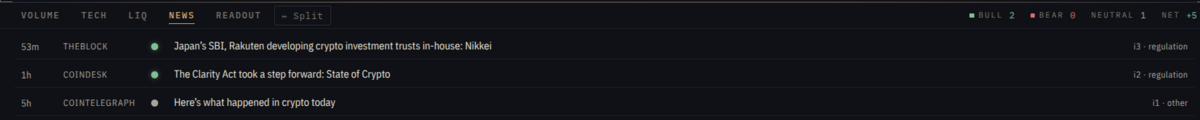
The classification is informational — the strategy engine never reads this stream. Its job is to make sure you're not the last person to find out why price just moved.
Since the US spot Bitcoin ETFs went live, a large slice of the demand that actually moves price no longer comes from crypto-native traders — it comes from the funds. When billions flow into IBIT and its peers, that buying has to be sourced somewhere; when the flows turn negative, someone is handing coins back. Tracking that tide tells you which way the largest and slowest pool of capital is leaning.
The ETF Flows panel sits in the same bottom strip as News, Volume and Tech. It shows the combined daily net flow into and out of every US spot Bitcoin ETF — green bars for net inflow days, red for outflow — and keeps the running tally for you: the latest day's figure, the 10-day net, and how many of the last ten sessions were inflows versus outflows.
One thing to keep in mind: these numbers are daily and land a day late, so treat them as regime context rather than a timing trigger. A steady wall of green underneath a rising market is a very different backdrop than the same rally quietly bleeding outflows. As with the headlines, the strategy engine never reads this stream — it's here to round out the picture.
Don't take this dashboard as a black box that tells you what to do. Use it as one more layer of confluence on top of whatever read you already trust. Sit with it for a few sessions, watch how structure, flow and levels line up around the moves you'd have taken anyway, and let it sharpen your own thinking instead of replacing it.
If you give it a real go, I'd love to hear how it goes: what helped, what got in the way, what felt missing, what you'd build differently. Share the trades you took, the ones you skipped because of what you saw here, and anything you wish the screen was telling you that it currently isn't. Every bit of that feedback is what shapes the next iteration.
I'm an engineer who codes the tools, but you are the one trading them. If you're a trader and something on this dashboard is unclear, missing, half-baked, or just wrong from a market-reading perspective, I want to hear about it. The same goes for ideas: an indicator I haven't added, a filter you'd want, a way the readout could be sharper, a feature that would change the way you sit in front of the chart. Drop me a line in the Telegram group with whatever you've got. I read every message, and what you tell me directly shapes what gets built next.